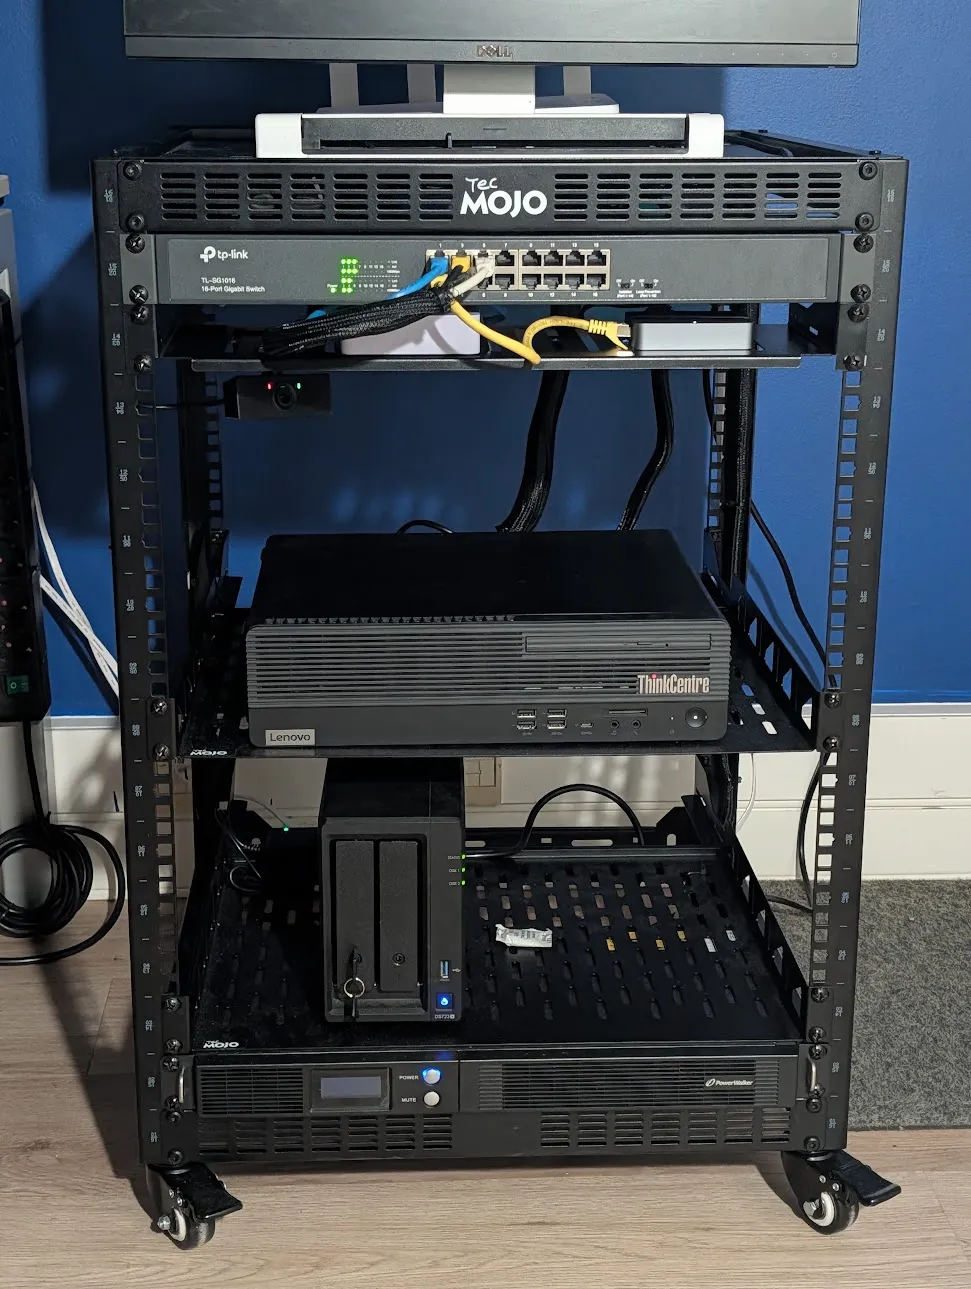
I carry a MacBook Pro, but I don’t really work on it. My work happens in this rack, on two dev boxes where my coding agents run too, next to everything I use daily: Jellyfin, Paperless, my notes, my bookmarks and a local LLM. The rack serves nobody but me, and nothing in it is reachable from the internet.
Almost all of it runs on one office PC with Proxmox, and a push to main reaches the machines within a minute. Here is how it fits together, from the hardware up.
The rack
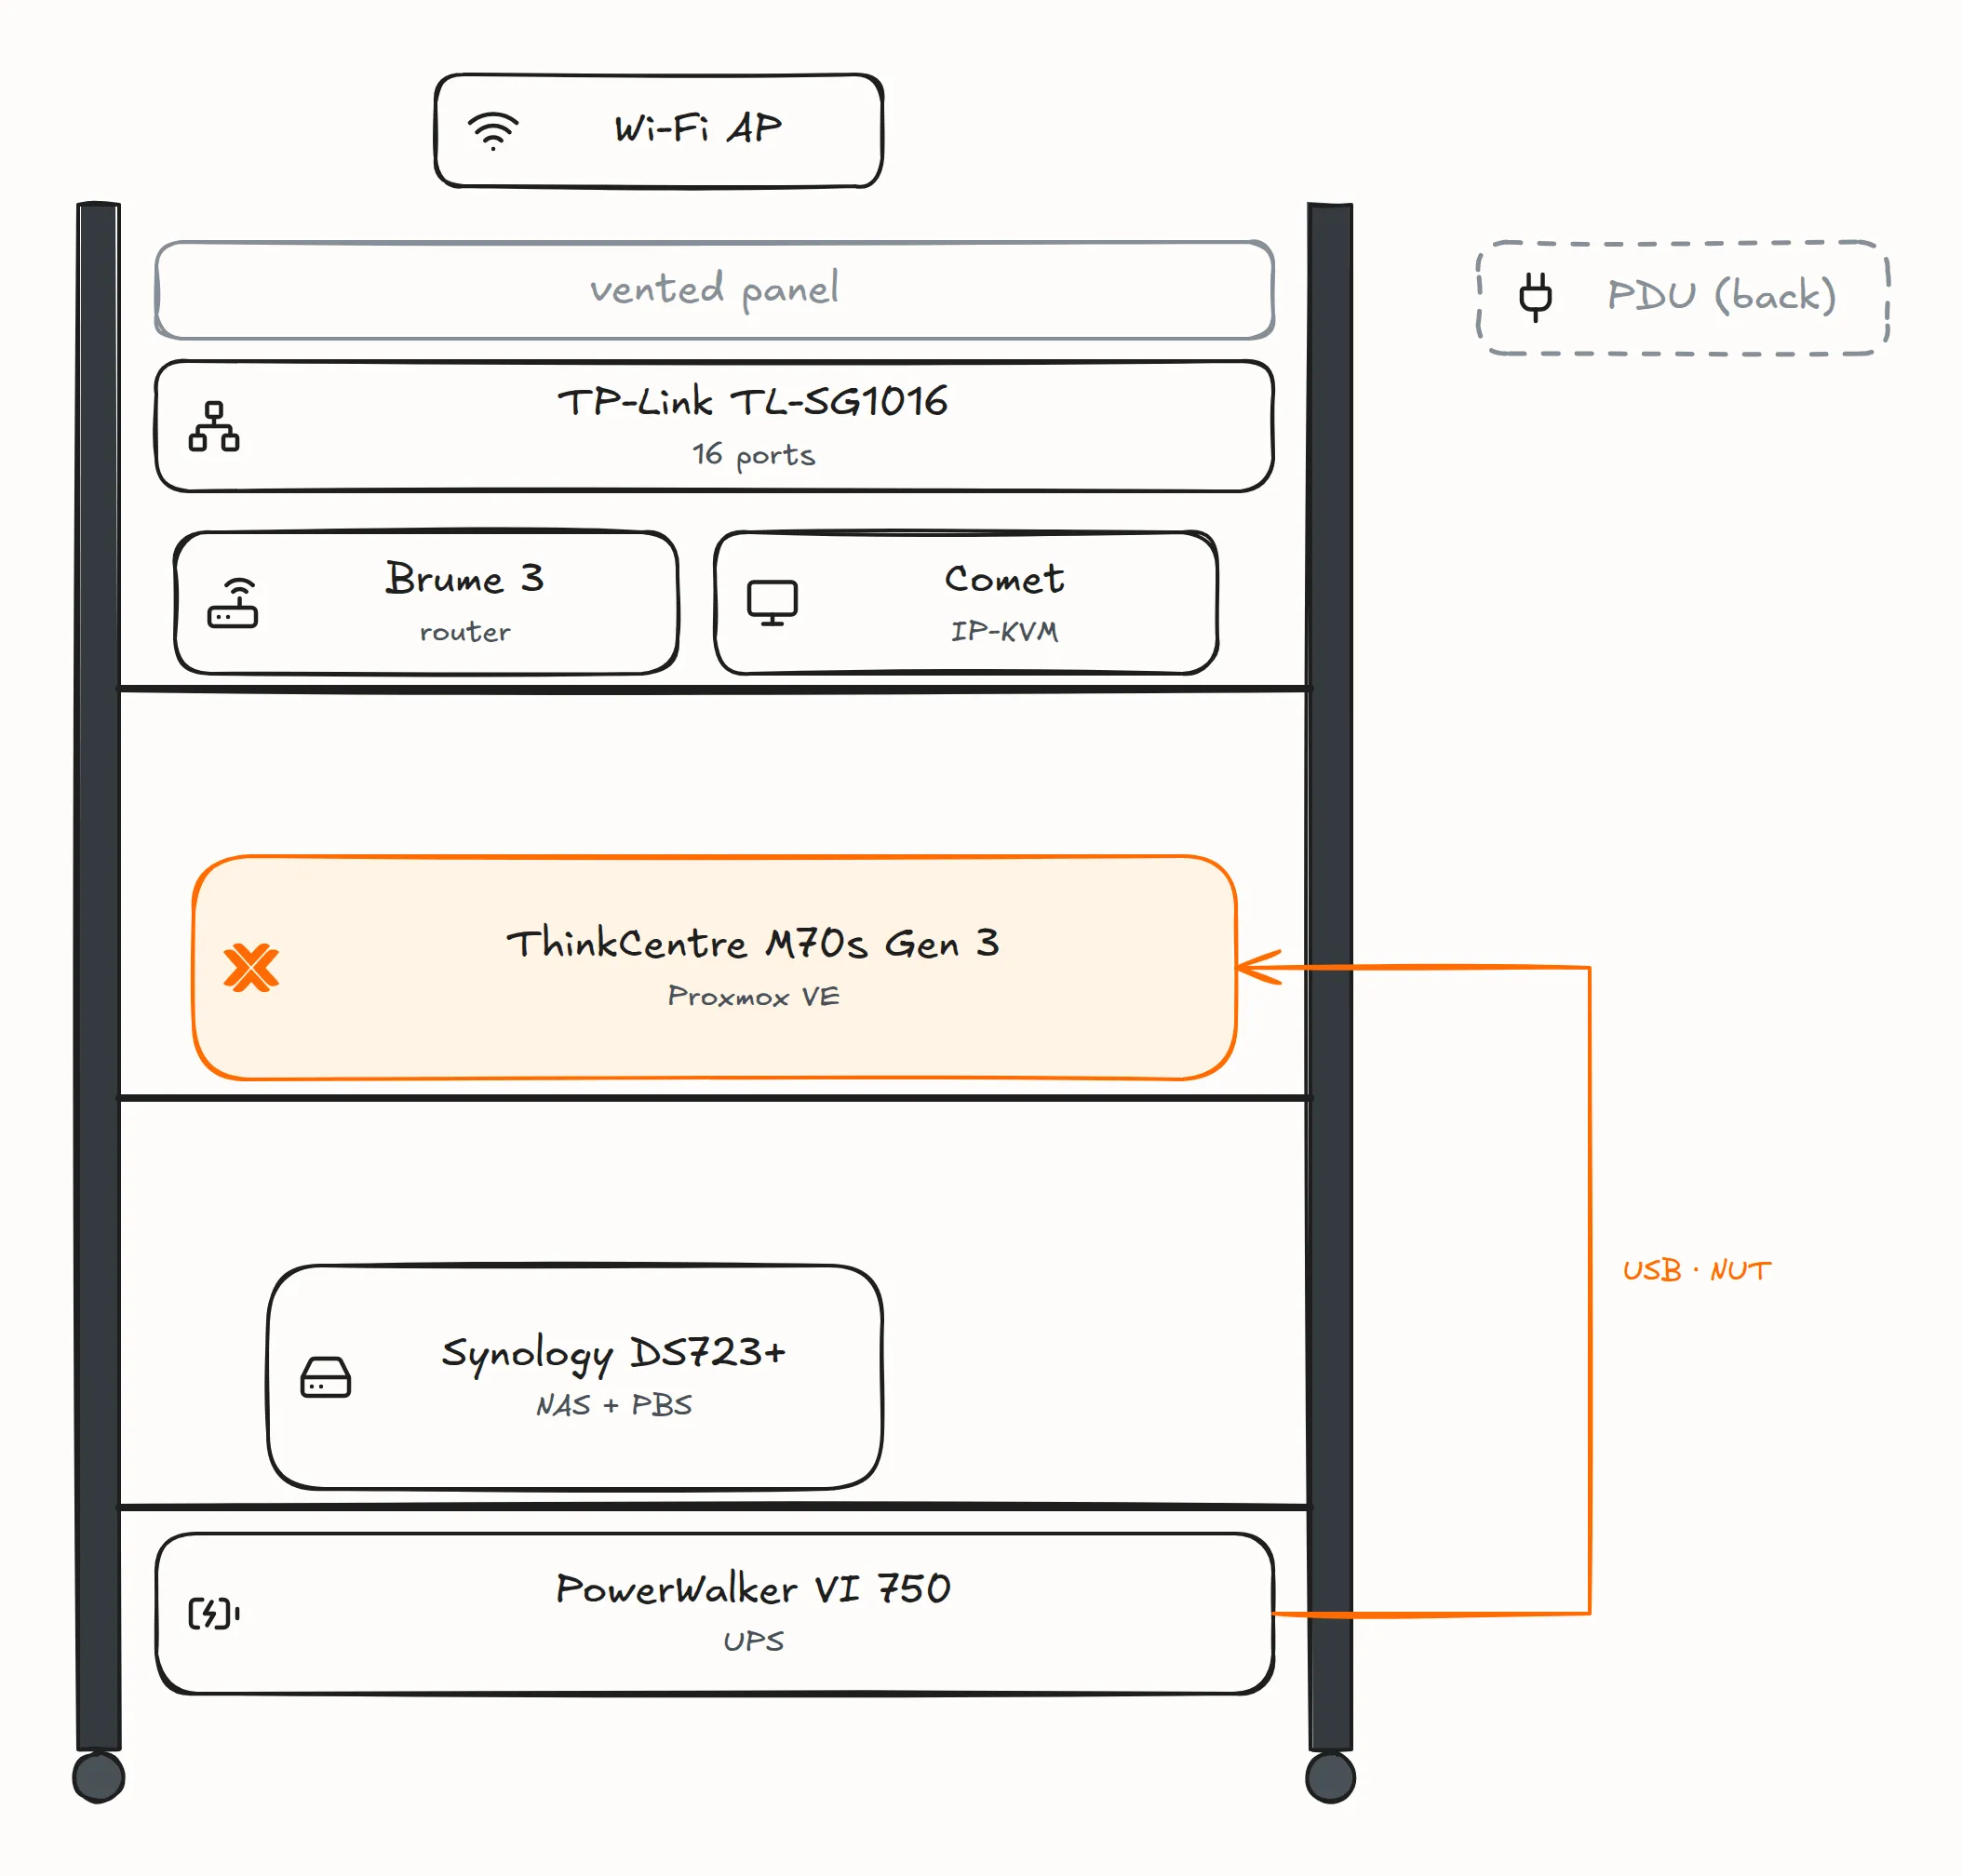
The hypervisor is a Lenovo ThinkCentre M70s Gen 3: an Intel Core i7-12700 (12 cores, 20 threads), 64 GB of DDR4 without ECC, a 512 GB NVMe drive and a 1 TB SATA SSD, with an Intel I210-T1 card as the uplink. Being an office PC, it has no remote console like iDRAC or IPMI, so a GL.iNet Comet (GL-RM1) IP-KVM sits on its HDMI and USB ports, and wakes it over Wake-on-LAN.
Around it, in a Tecmojo 16U open-frame rack:
- a Synology DS723+ with a 2 TB SSD and a 4 TB HDD, each its own volume, running Proxmox Backup Server (PBS) in a container and holding my media;
- a GL.iNet Brume 3 (GL-MT5000), the router: the rack’s LAN, its DHCP, and a second DNS resolver for my devices. It is never a VM on the hypervisor, since it would then wait for the machine it routes;
- an HONOR Router 3 on top, as the Wi-Fi access point and the router’s cold spare;
- a TP-Link TL-SG1016, an unmanaged 16-port switch;
- a Shelly Plug S Gen3 feeding the ThinkCentre, to power-cycle it if its kernel ever freezes;
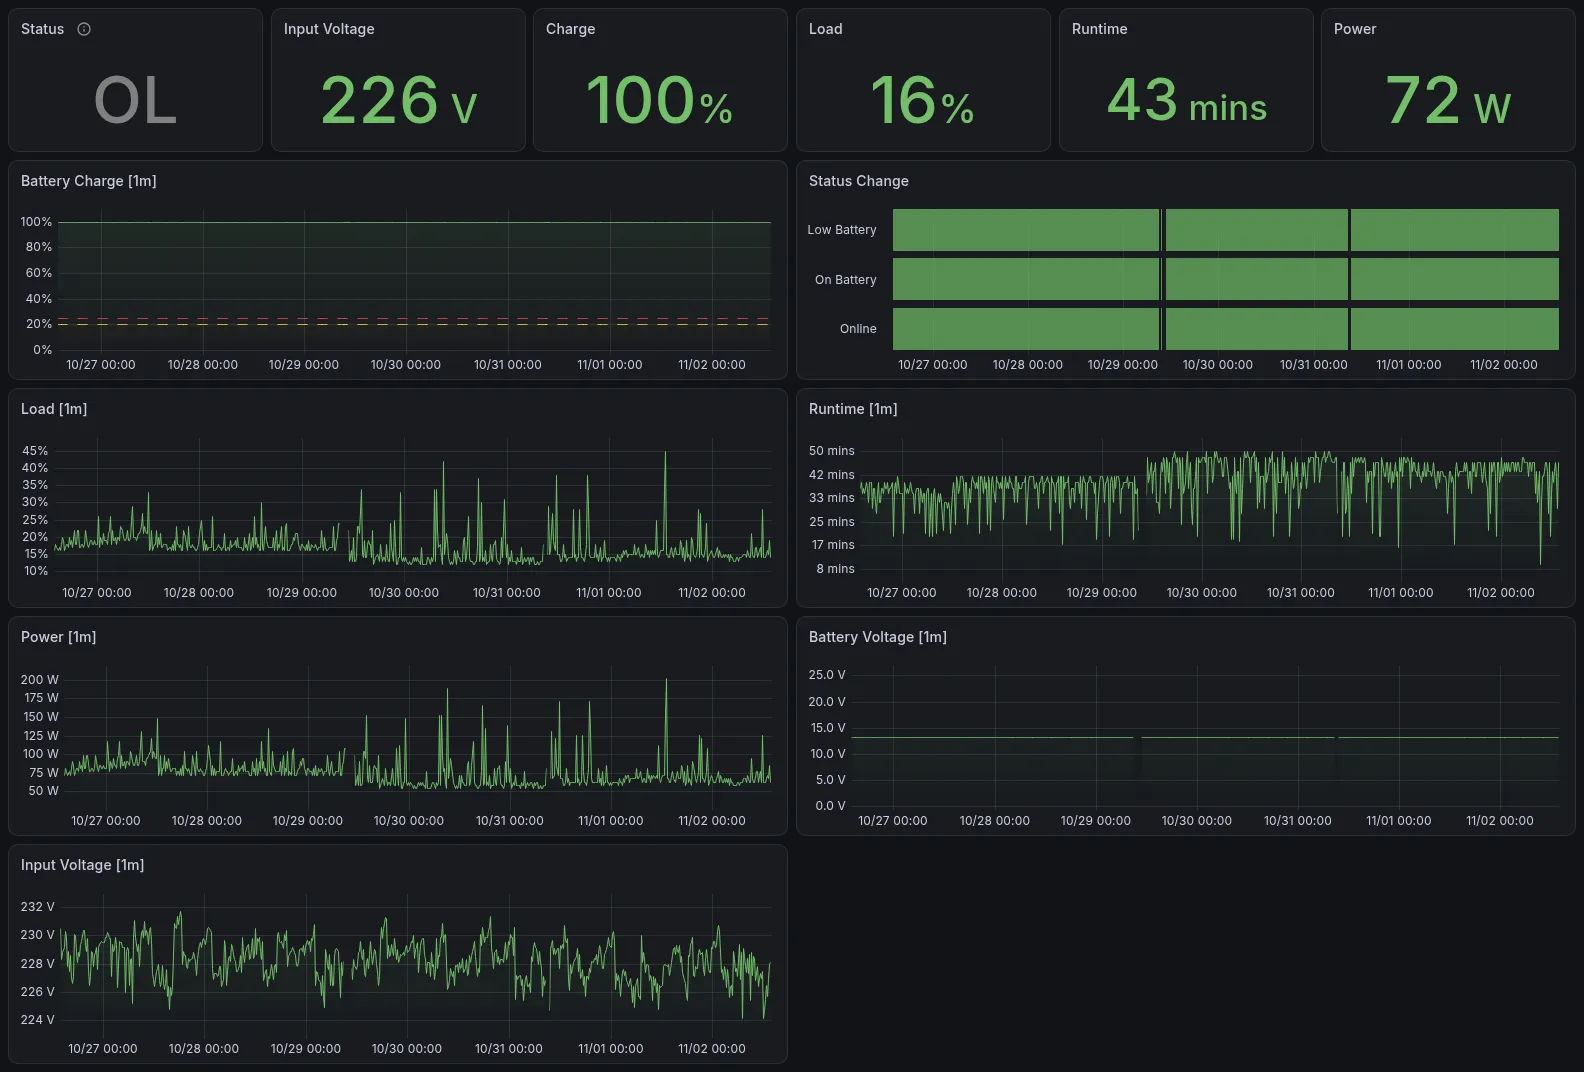
- a PowerWalker VI 750 R1U UPS on the hypervisor’s USB, served by NUT, which shuts down the hypervisor and the NAS on a power cut. What it gets wrong is in My UPS Lies.
The UPS puts the draw at 76 W on average over a week, and 216 W at its highest. That is its load percentage times its 450 W rating, so a rough figure, but at France’s regulated rate of €0.20/kWh, it comes to about €135 a year, VAT included.
What runs on it
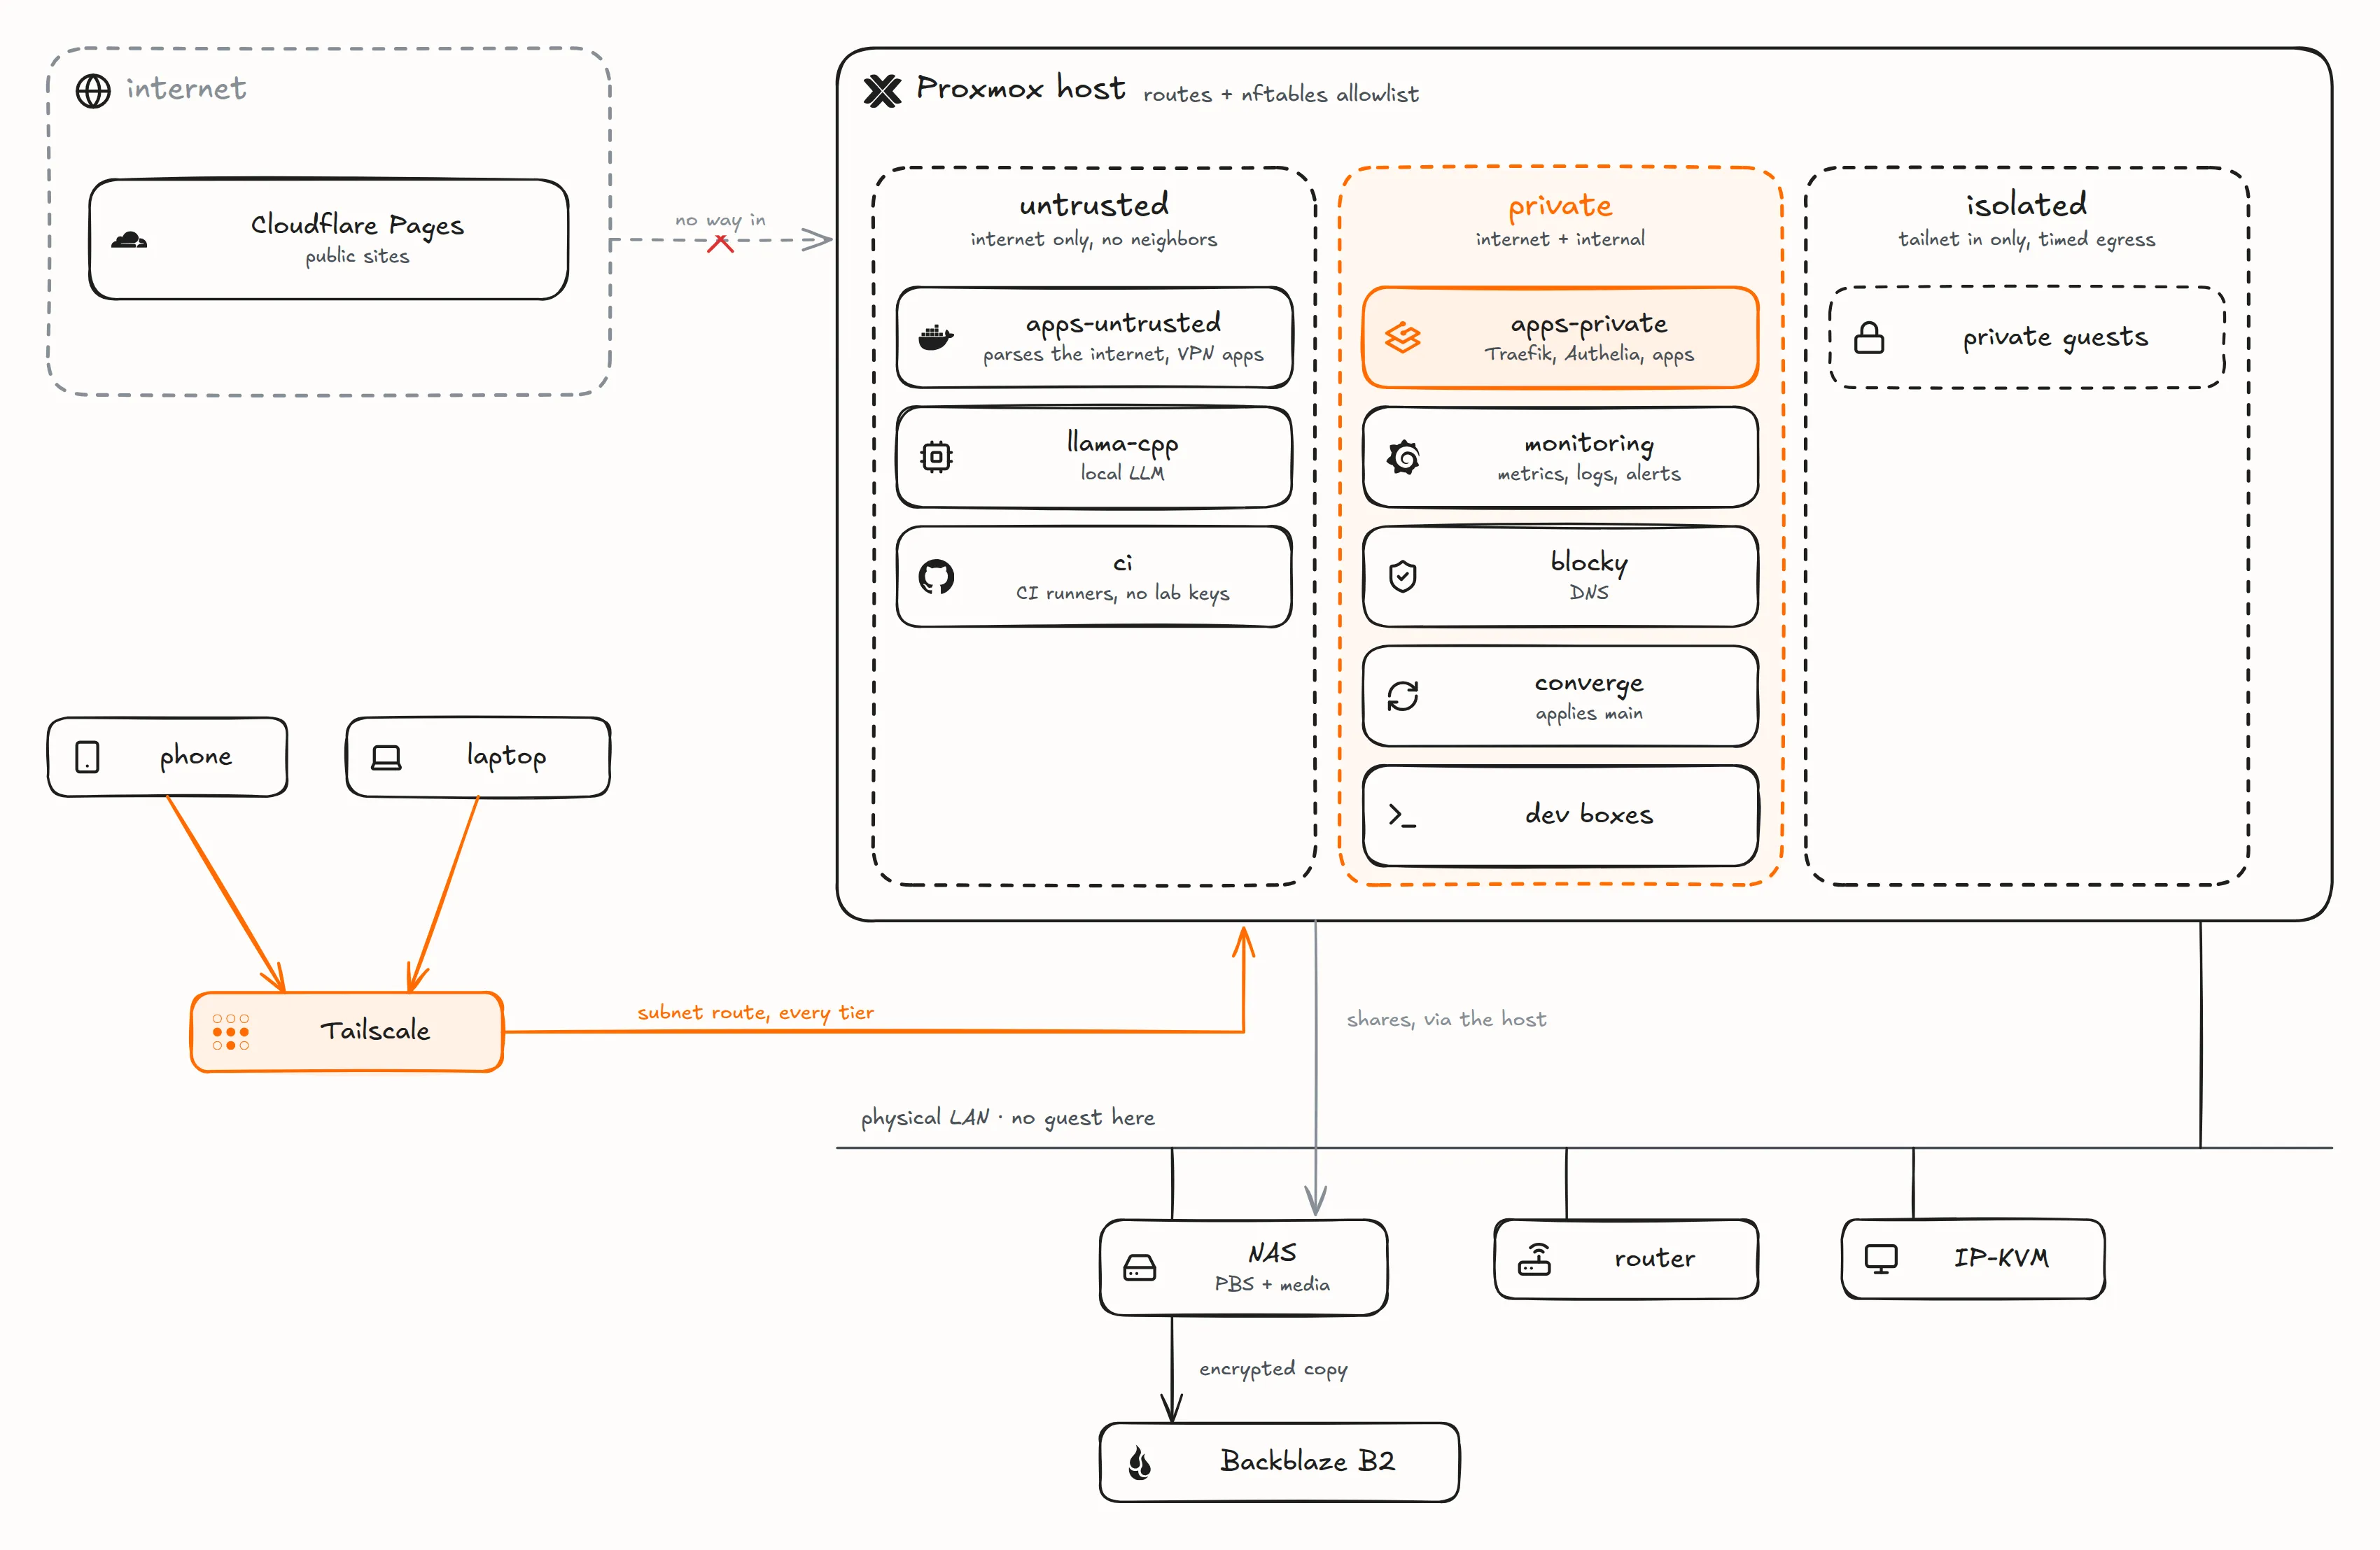
Five rules, written at the top of the lab’s docs, decide most of what follows:
- Nothing public reaches the lab: no inbound port, no tunnel. The public sites, this blog included, are Cloudflare Pages projects.
- Private by default: lab names resolve to a private address, reached through Tailscale.
- One front door: Traefik terminates TLS for every service, and Authelia puts a single sign-on in front of it.
- No guest on the physical LAN: only the hypervisor has an address there.
- Everything is in git, secrets included as ciphertext, and a push to
mainis live within minutes.
The hypervisor runs Proxmox VE and nothing else but the exporters that read its hardware, and NUT, which has to outlive every guest to shut them down. Everything else is a guest, backed up and removable.
Almost every app I self-host is a Docker Compose project, on one of three Debian VMs. Two are split by trust rather than by load: apps-private carries Traefik, Authelia and every app I vouch for, each with its own database when it needs one: Paperless, Outline, linkding, Open WebUI, Presto (my own time tracker), Jellyfin, Navidrome and more. apps-untrusted gets what parses content from the internet: downloads and two remote browsers behind a commercial VPN, document conversion. The third, monitoring, holds the monitoring stack. That is about fifty containers in all, on VMs given 12, 8 and 4 GiB of RAM. Proxmox recommends running application containers in a VM, and NIST SP 800-190 groups containers by sensitivity on separate kernels: here the trust tier (more below) is the kernel boundary, and inside a VM each project’s Compose network is the one between apps.
The rest are guests of their own, mostly unprivileged LXC containers installed by an Ansible role:
blocky, the DNS for my devices: Blocky as a binary under systemd, in a guest of its own so that no app’s restart takes DNS with it;converge, which pulls the repository and applies it to the lab (more below);llama-cpp, local inference on the CPU with llama.cpp. It is an app, but an LXC: a container takes its RAM only while it answers, where a VM would hold it all day;- the two dev boxes, one personal and one for client work: the same tools, but no key or account shared between them;
ci, a VM with GitHub’s self-hosted runners, one per repository, for every repository I own;- four desktop VMs, mostly stopped: two Windows 11, a Windows XP and an Ubuntu desktop;
- a few private guests in the isolated tier, closed to my coding agents.
A guest’s name says what it runs, so blocky in an alert at 3 a.m. needs no lookup, and its ID and address are chosen apart from it, so renaming one never moves the others. Proxmox tags carry the rest: what a guest is for, its tier, and restricted on the few my coding agents may not open.
The network is split into tiers, like a cloud VPC
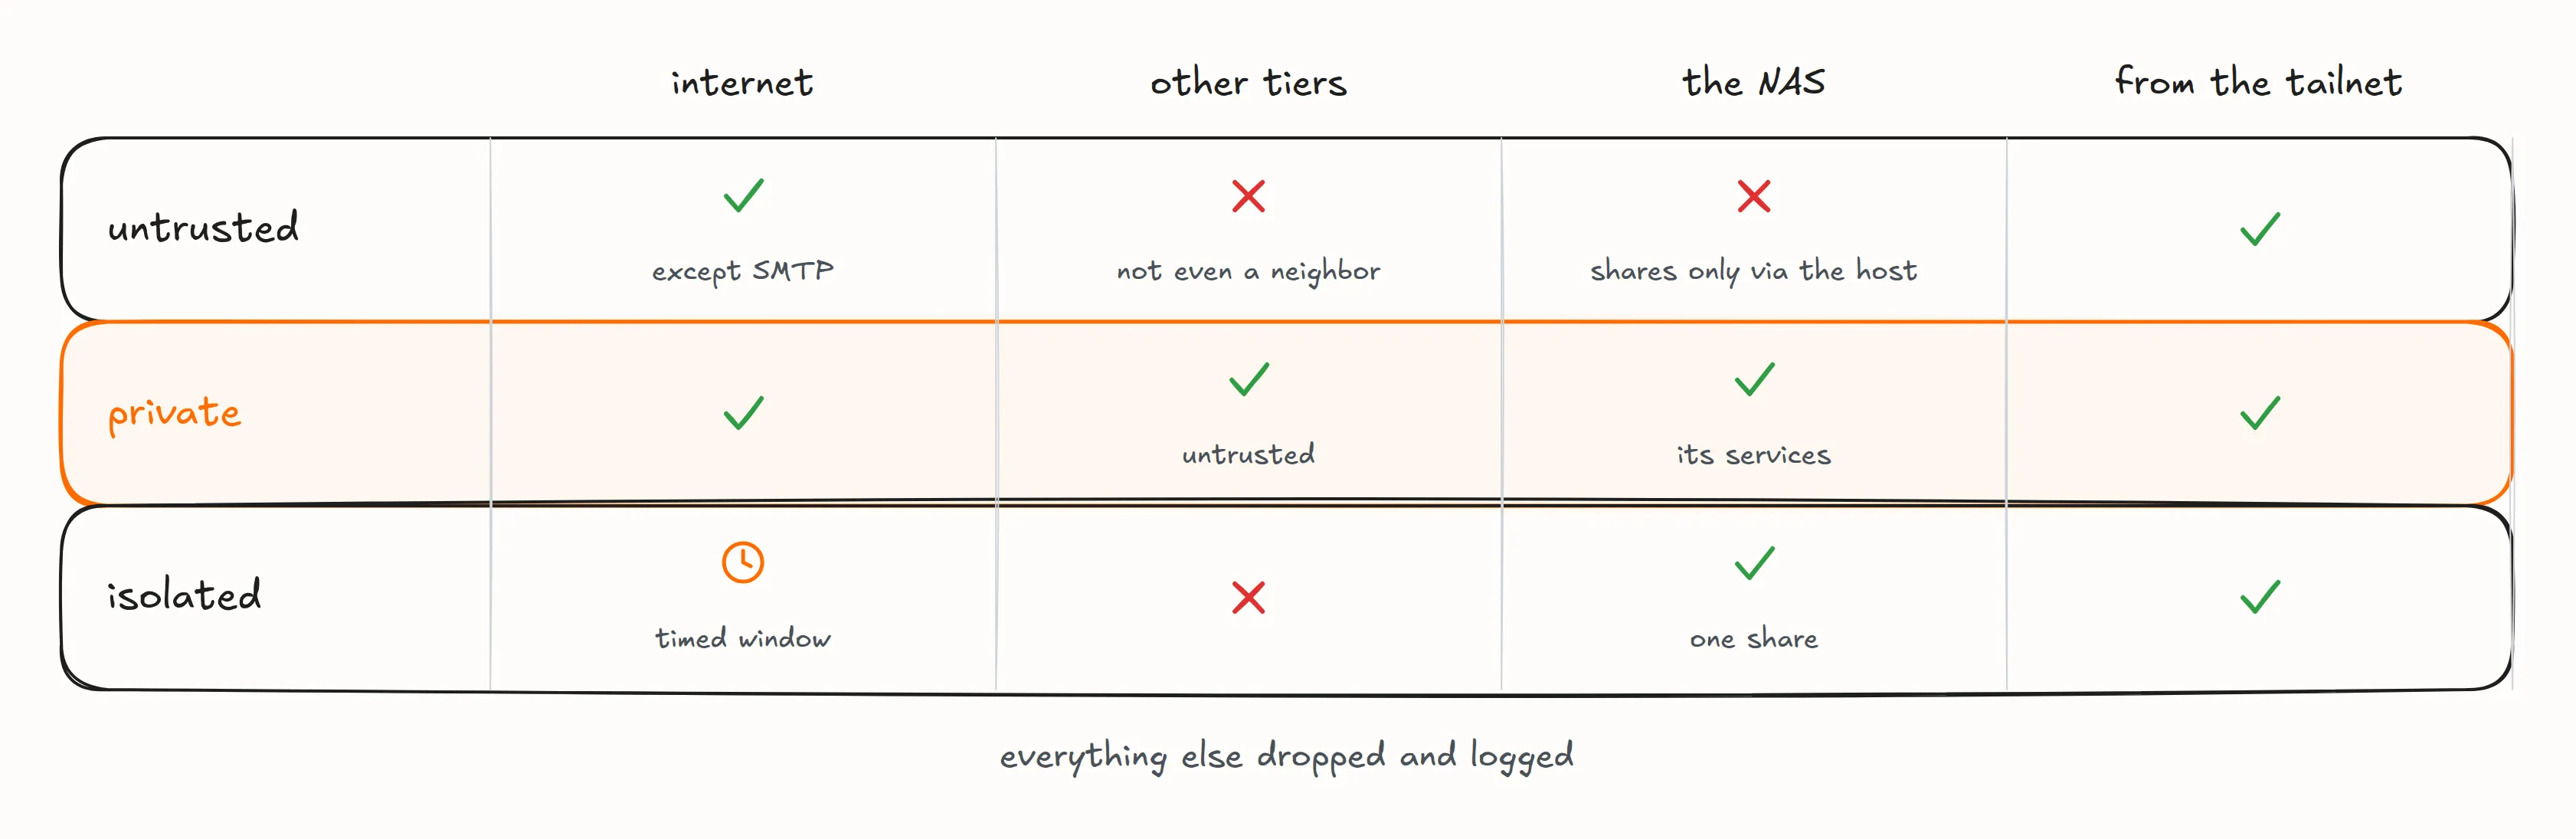
Behind the router, the hypervisor routes everything, without NAT: the router is the only NAT, out to the internet, and routes the tiers back to the hypervisor, so the NAS sees each guest’s own address. Each tier is a Linux bridge with no physical port, so its traffic never leaves the host, and the hypervisor is its gateway:
- physical LAN: the hypervisor, the NAS, the router, the access point and the IP-KVM, never a guest;
- untrusted: the internet except outgoing mail (SMTP), and nothing inside the lab, not even a neighbor on the same tier.
apps-untrusted,llama-cpp(it loads models from the internet) and the CI runner (it runs whatever a pull request says) live here; - private: the internet and the internal side.
apps-private,monitoring,blocky, the converge and the dev boxes live here; - isolated: where my private guests live. No internet outside a timed window, nothing gets in but the tailnet, and nothing goes out but its declared endpoints: today one SMB share on the NAS.
The untrusted tier never reaches the NAS at all. The hypervisor mounts the downloads share and hands it to apps-untrusted with virtiofs, and gives the media to apps-private, read-only, the same way.
The firewall is one nftables allowlist on the hypervisor, applied before any guest boots. It refuses and logs anything not listed, so a mistake shows up as a refusal in the log rather than as an opening, and a probe checks the whole matrix after any change. Tiers match bridges by name pattern, so a new bridge inherits its tier’s rules without touching the firewall. The tiers aren’t in the Proxmox firewall, whose filter for routed traffic is still a tech preview and can’t express “not even a neighbor” or a timed window. It carries the per-guest rules instead, the equivalent of a cloud’s security groups: every guest that guards something, every app VM included, gets a file of its own that denies everything inbound but the callers it names. IPv6 is dropped everywhere.
Tailscale is the only way in from the network
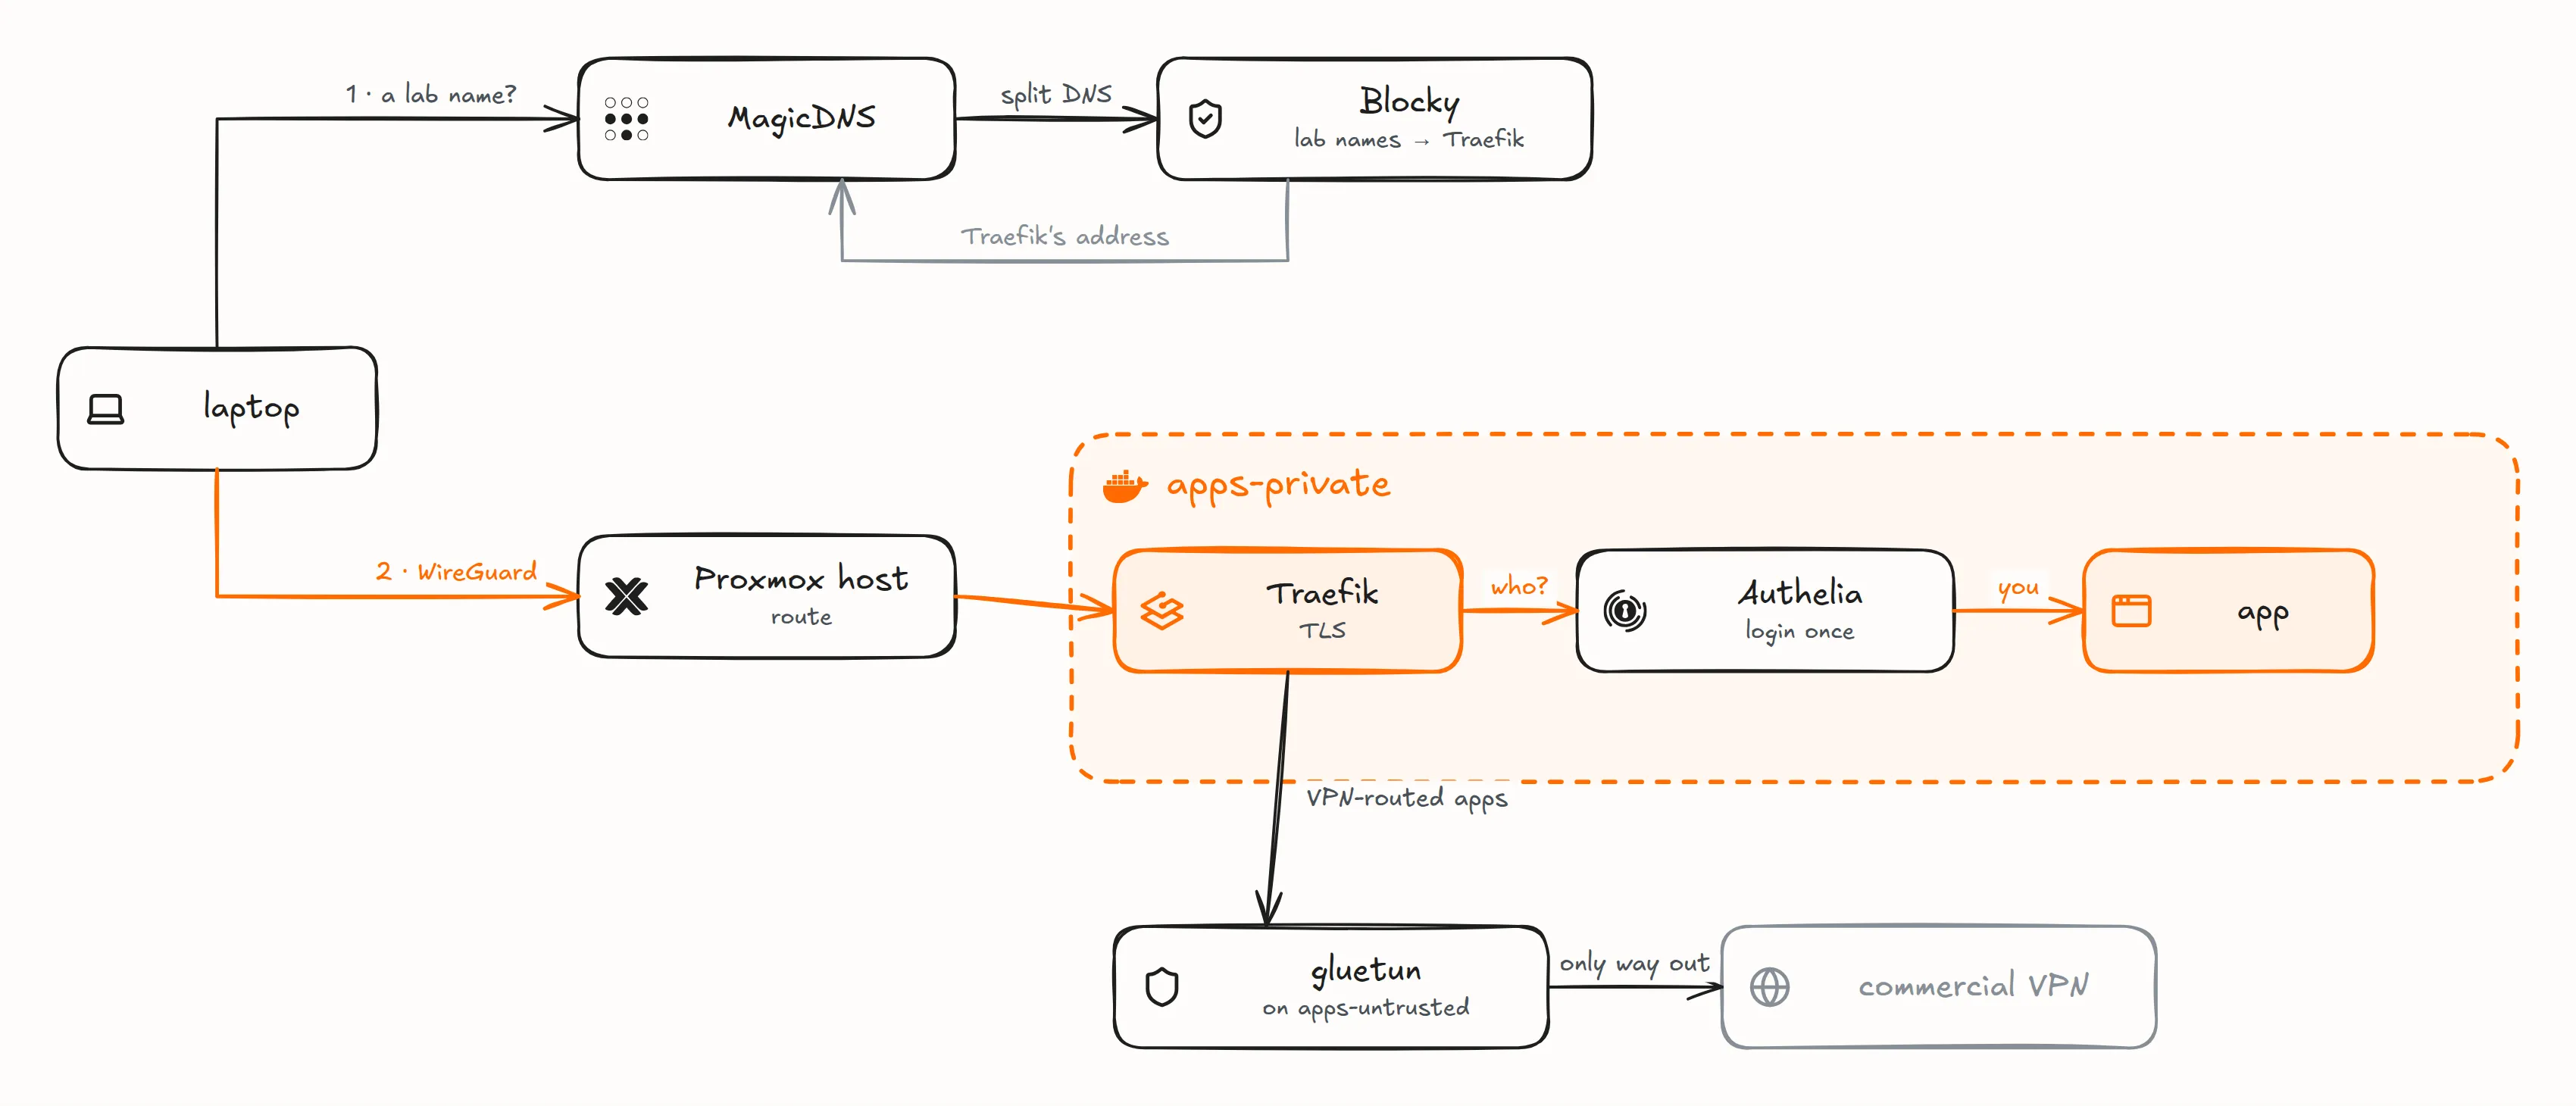
The hypervisor advertises the three tiers as a Tailscale subnet route, and my laptop and phone reach every guest through it. The host itself doesn’t use the tailnet’s DNS or accept its routes. The tailnet is how I get in, and the lab never uses it to talk to itself: traffic between the guests and the rack’s machines, like the backups and the NAS’s UPS client, goes over the LAN, routed by the hypervisor, and none of it depends on Tailscale running. No guest runs Tailscale, with one exception: an app I share with someone outside joins the tailnet as its own machine, and only that machine is shared with them.
Opening an app takes one lookup and one login. MagicDNS sends lab names to Blocky, which answers with Traefik’s address. Traefik terminates TLS on apps-private, and Authelia checks who I am once, either in front of the app or as its OpenID Connect provider for the apps that speak it, Proxmox and the NAS included. Jellyfin keeps its own login, because its TV and phone apps can’t follow a login redirect. Every route is a line in one file of the repository: Traefik reads no Docker socket, so a container label routes nothing. Its certificate is a single wildcard, validated through DNS, so no service name ends up in the public certificate logs.
Every other lookup from my devices goes to two resolvers at once, Blocky and the AdGuard Home on the Brume 3, and Tailscale takes the first answer. Both load the same blocklist, and the router’s stays up when the hypervisor is down. The hypervisor, the guests and the rack never resolve through Blocky: they use public resolvers, so that the host can still resolve while the guest that runs Blocky is down or being restored, and guests reach each other by address.
A signed push to main is the deployment
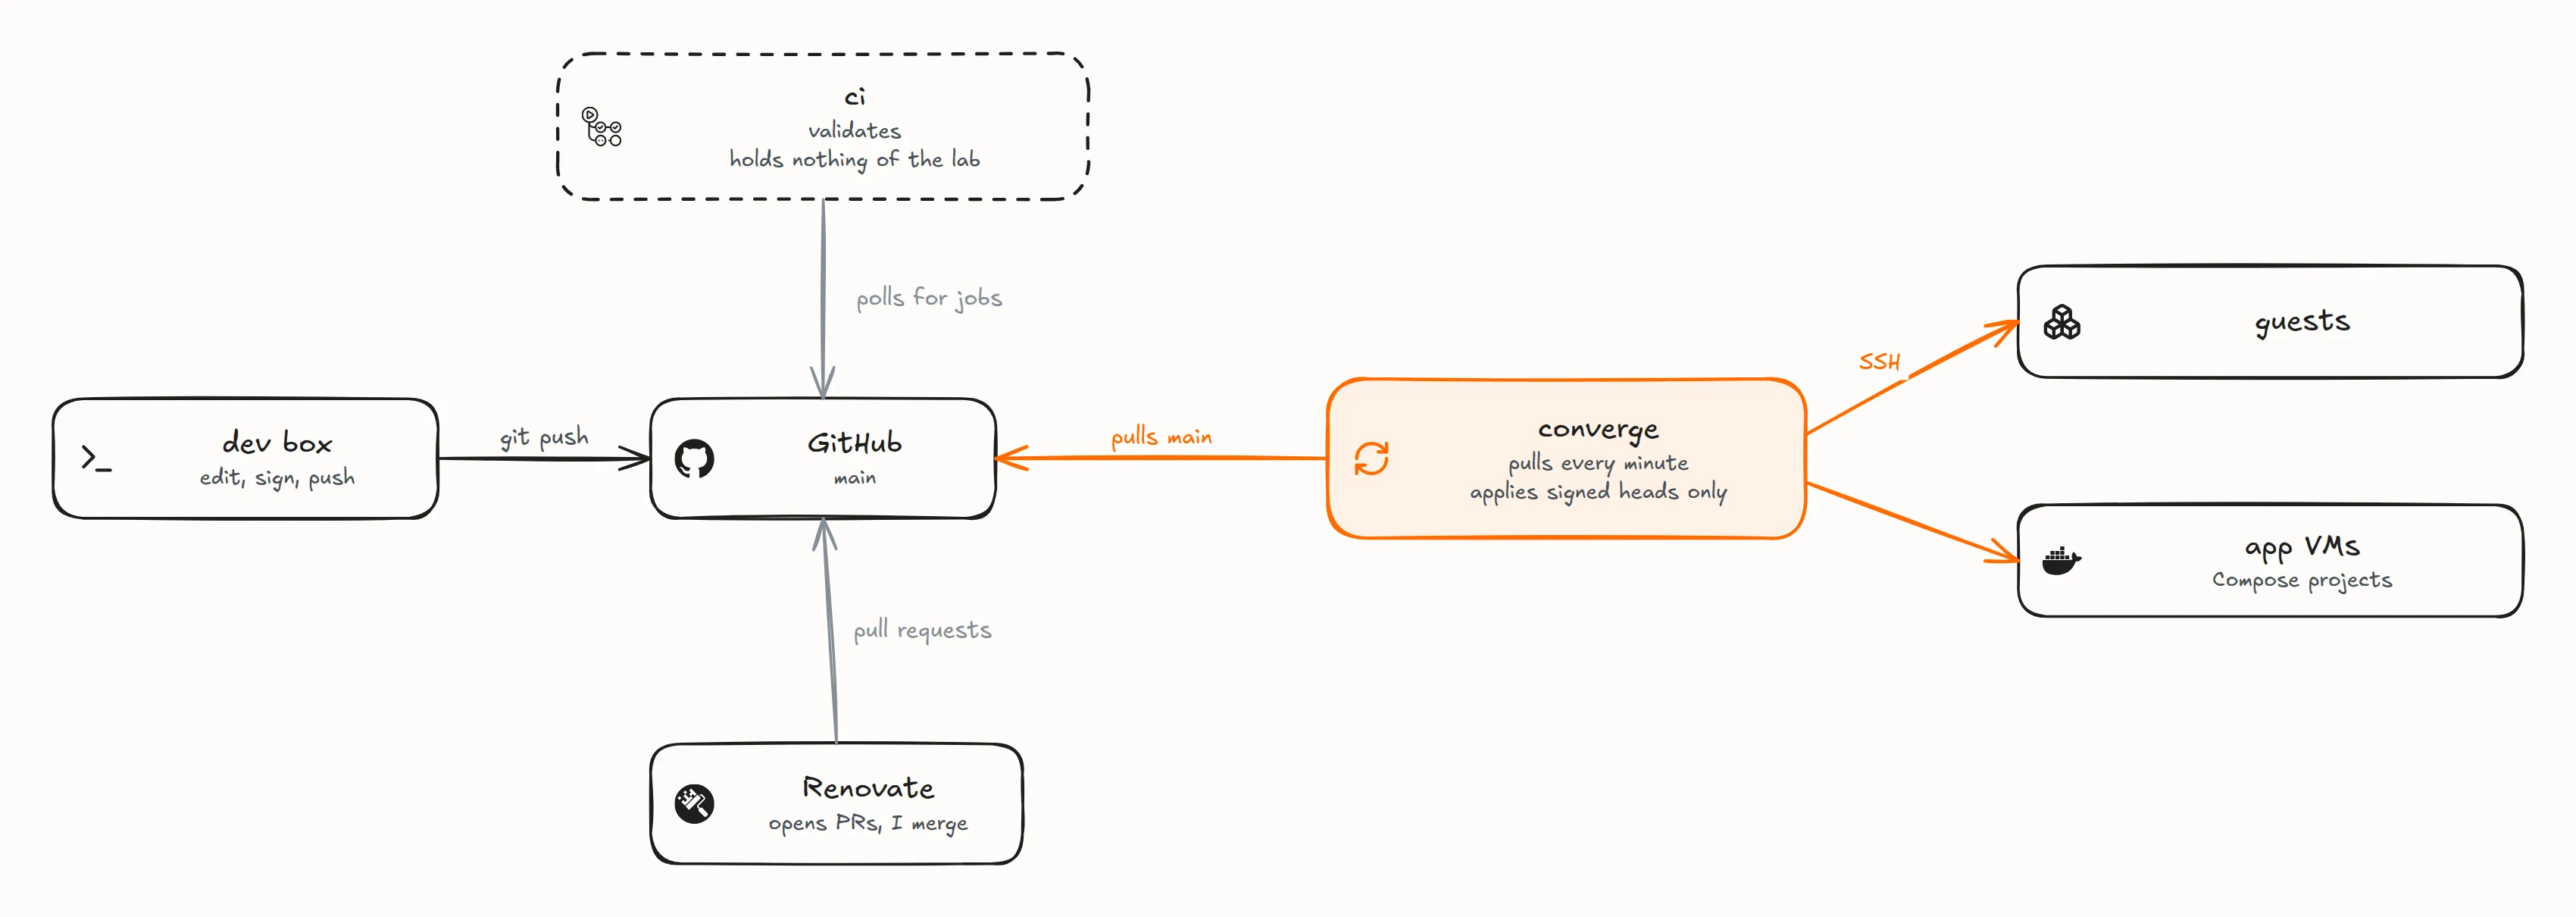
One private repository holds everything: the Ansible roles for the hypervisor and the guests, every Compose project, OpenTofu for Cloudflare, a copy of the Tailscale policy and the docs. Nothing outside the lab connects in to deploy. The converge pulls main every minute, applies what the push changed with Ansible, and applies everything once a day, so a change made by hand is put back within a day.
It applies main only when the newest commit carries my signature, so a stolen GitHub account can’t deploy on its own. The checks run on my dev box before a push and in CI beside the deploy, not in front of it: a red CI tells me to revert. Renovate opens the version bumps, and I merge every one that reaches the lab. Undoing anything is git revert and a push.
Every secret is committed, encrypted with SOPS and age, and decrypted only during an apply, into the environment or config file of whatever reads it. There is no Vault and no secret manager queried at run time, so nothing to run or unseal at boot. The repository and my age key rebuild the setup, and the backups bring back the data.
Its own post covers the deploy in detail: what a push applies, what the signature proves and what it doesn’t, and what happens when a commit breaks something.
Backups go to the NAS, then off-site
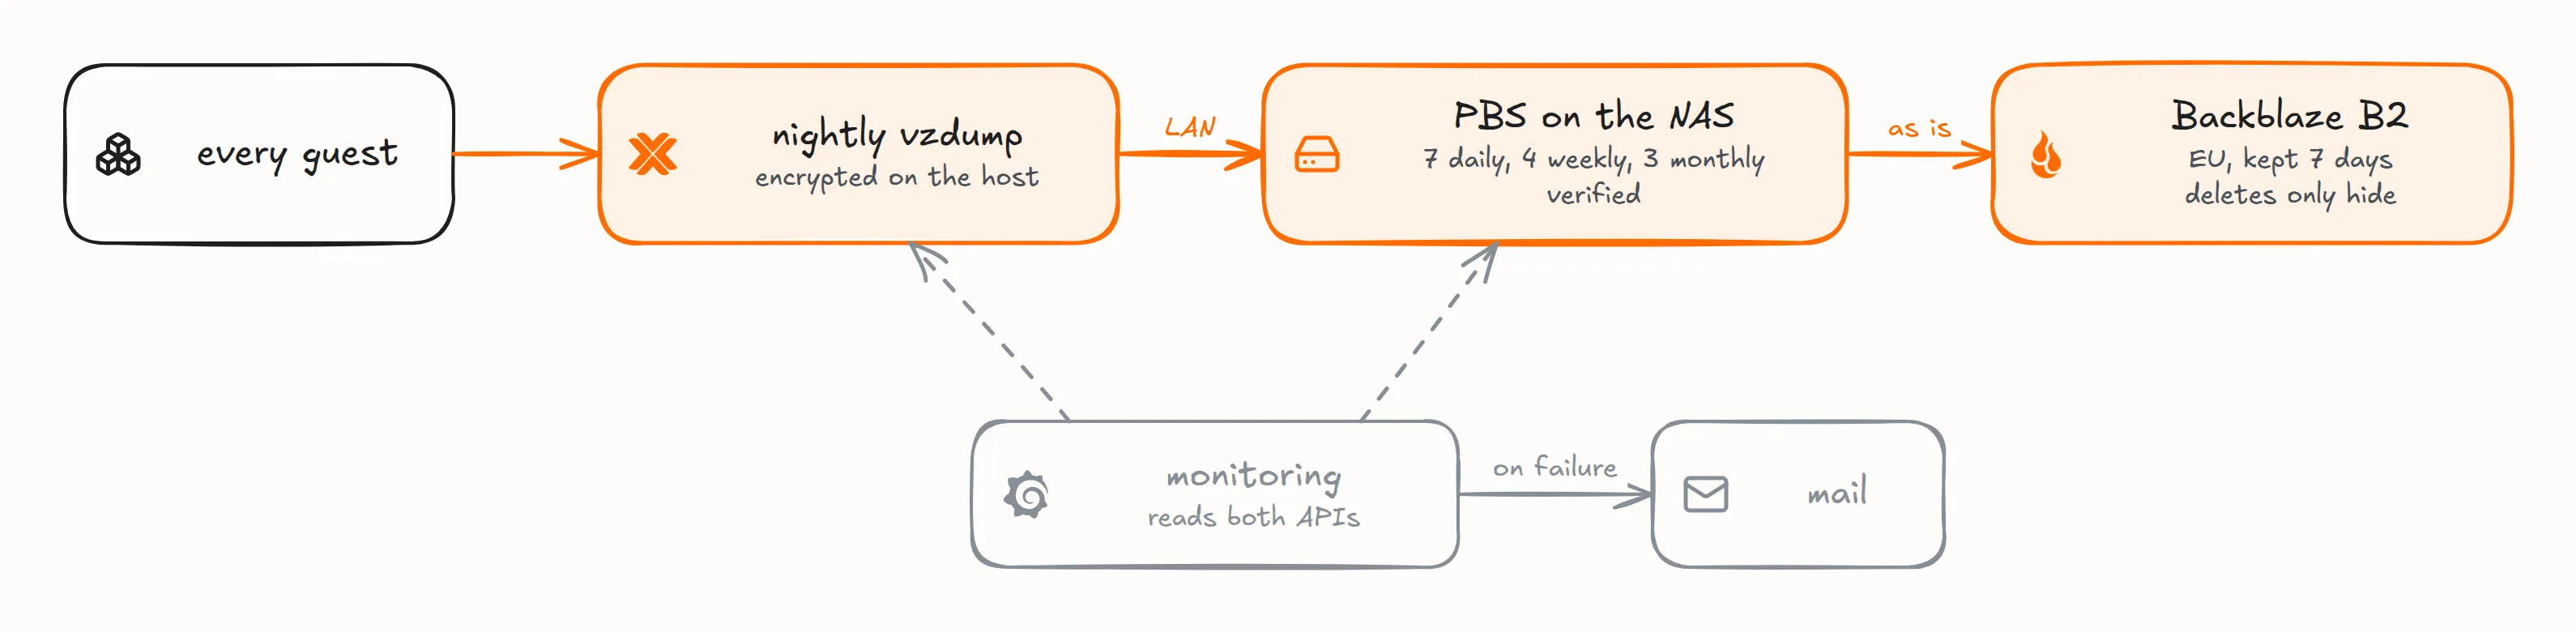
Every night, Proxmox backs up every guest to PBS on the NAS, over the LAN. The exceptions are two Windows templates, golden images that are never booted, and the Windows XP VM, which I back up on demand. Proxmox encrypts each backup before it leaves the host, so PBS only ever stores ciphertext and holds no key. PBS keeps 7 daily, 4 weekly and 3 monthly backups and verifies them, then copies those encrypted backups as they are to Backblaze B2 in the EU, kept seven days, for the day I lose the whole site. The B2 key that writes that copy can’t erase it: a delete only hides a file, which stays recoverable for a week. A single backup encryption key, also kept in my password manager, reads both copies.
An app’s data is its Compose project’s named volumes, on its VM’s system disk, so it leaves with the VM’s nightly backup. Caches and transcodes live on a second disk the backup skips, since they can be fetched again. Media aren’t in the backups at all: the music and films live on the NAS, which the lab uses as storage and doesn’t back up.
Once a month, the hypervisor restores the smallest container’s newest backup to a scratch guest, checks that its filesystem is whole, and destroys it; an alert fires when that hasn’t happened for 35 days. By hand, I’ve restored one app’s volumes, a whole app VM, and a container’s files from the off-site copy, opened with nothing but that encryption key.
Proxmox backups don’t keep a guest’s snapshots, and nothing warns you: a guest restored from one comes back with no snapshot history.
A cold boot waits for my passphrase

On the hypervisor, the guests live in encrypted LUKS2 volumes, and the swap gets a new random key at every boot. Proxmox itself boots, joins the tailnet and, after a power-on, waits for me to unlock the guests with one passphrase. A plain reboot doesn’t ask: Proxmox jumps straight into the next kernel with kexec, carrying the volume keys over in RAM, never on disk, and the guests come back on their own.
Monitoring
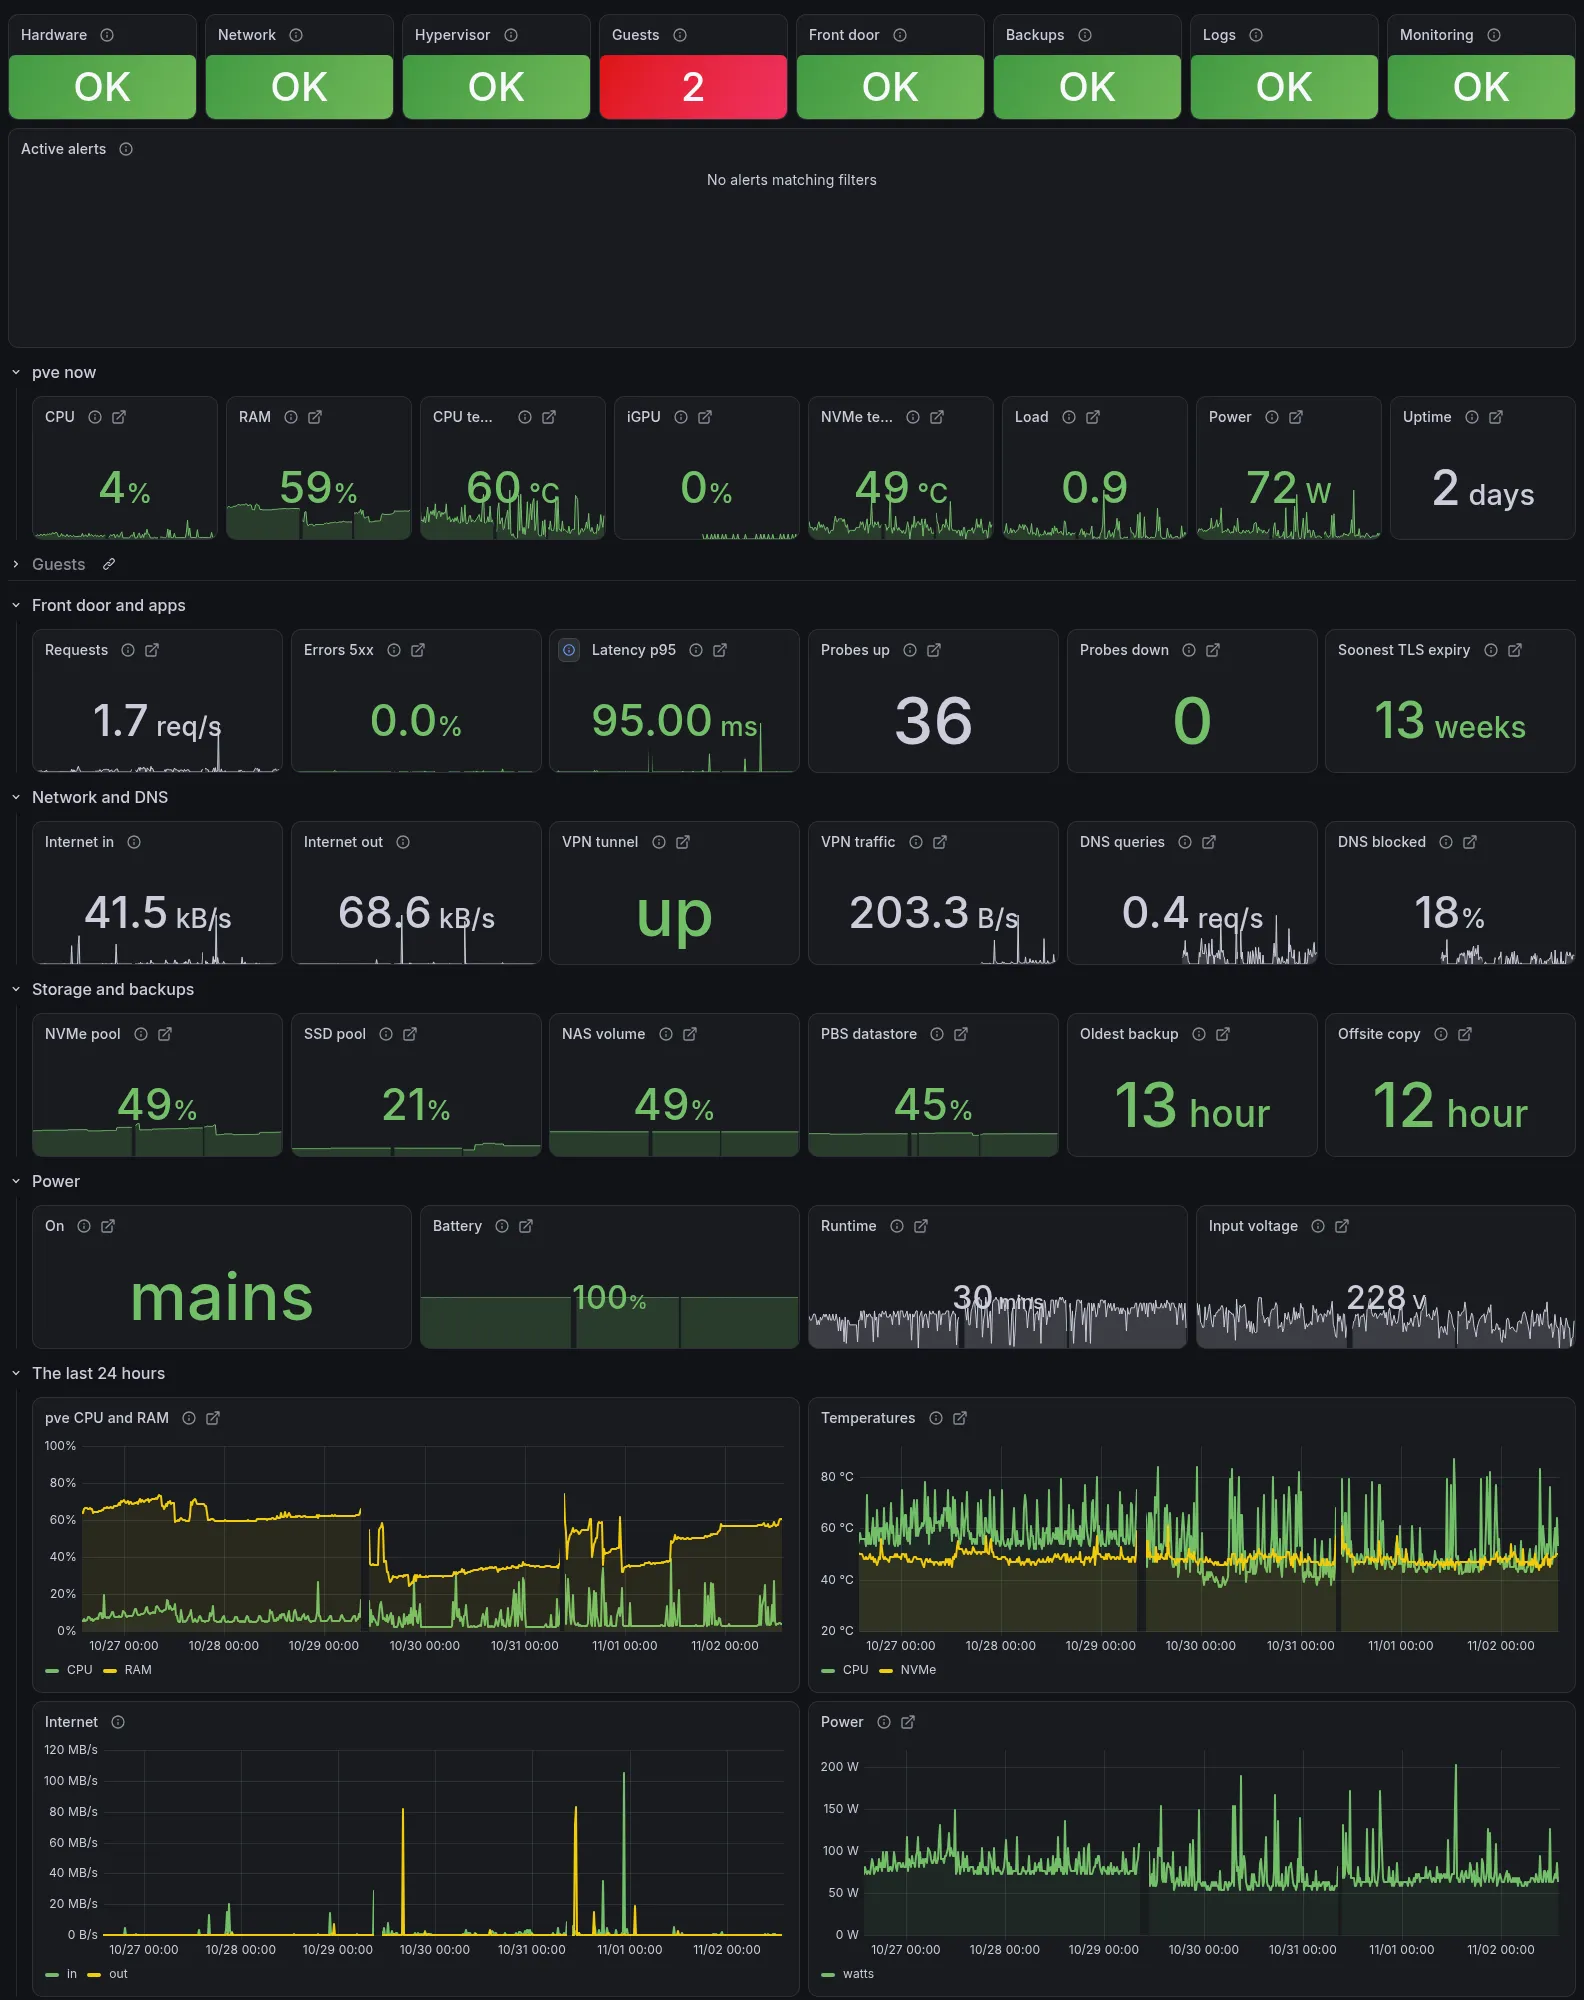
The home dashboard counts each layer’s problems, green at zero. A container that disappears counts as a problem for 24 hours, so the red 2 here is a retired app and a one-off run, removed the day before.
Prometheus, Loki, Alloy (which ships the logs) and Grafana are one Compose project on the monitoring VM, and every app VM runs cAdvisor for its containers’ metrics. Loki gets every container’s output and the hypervisor’s kernel errors. The dashboards are filed by layer: hardware, hypervisor, network, front door, guests, backups and logs.
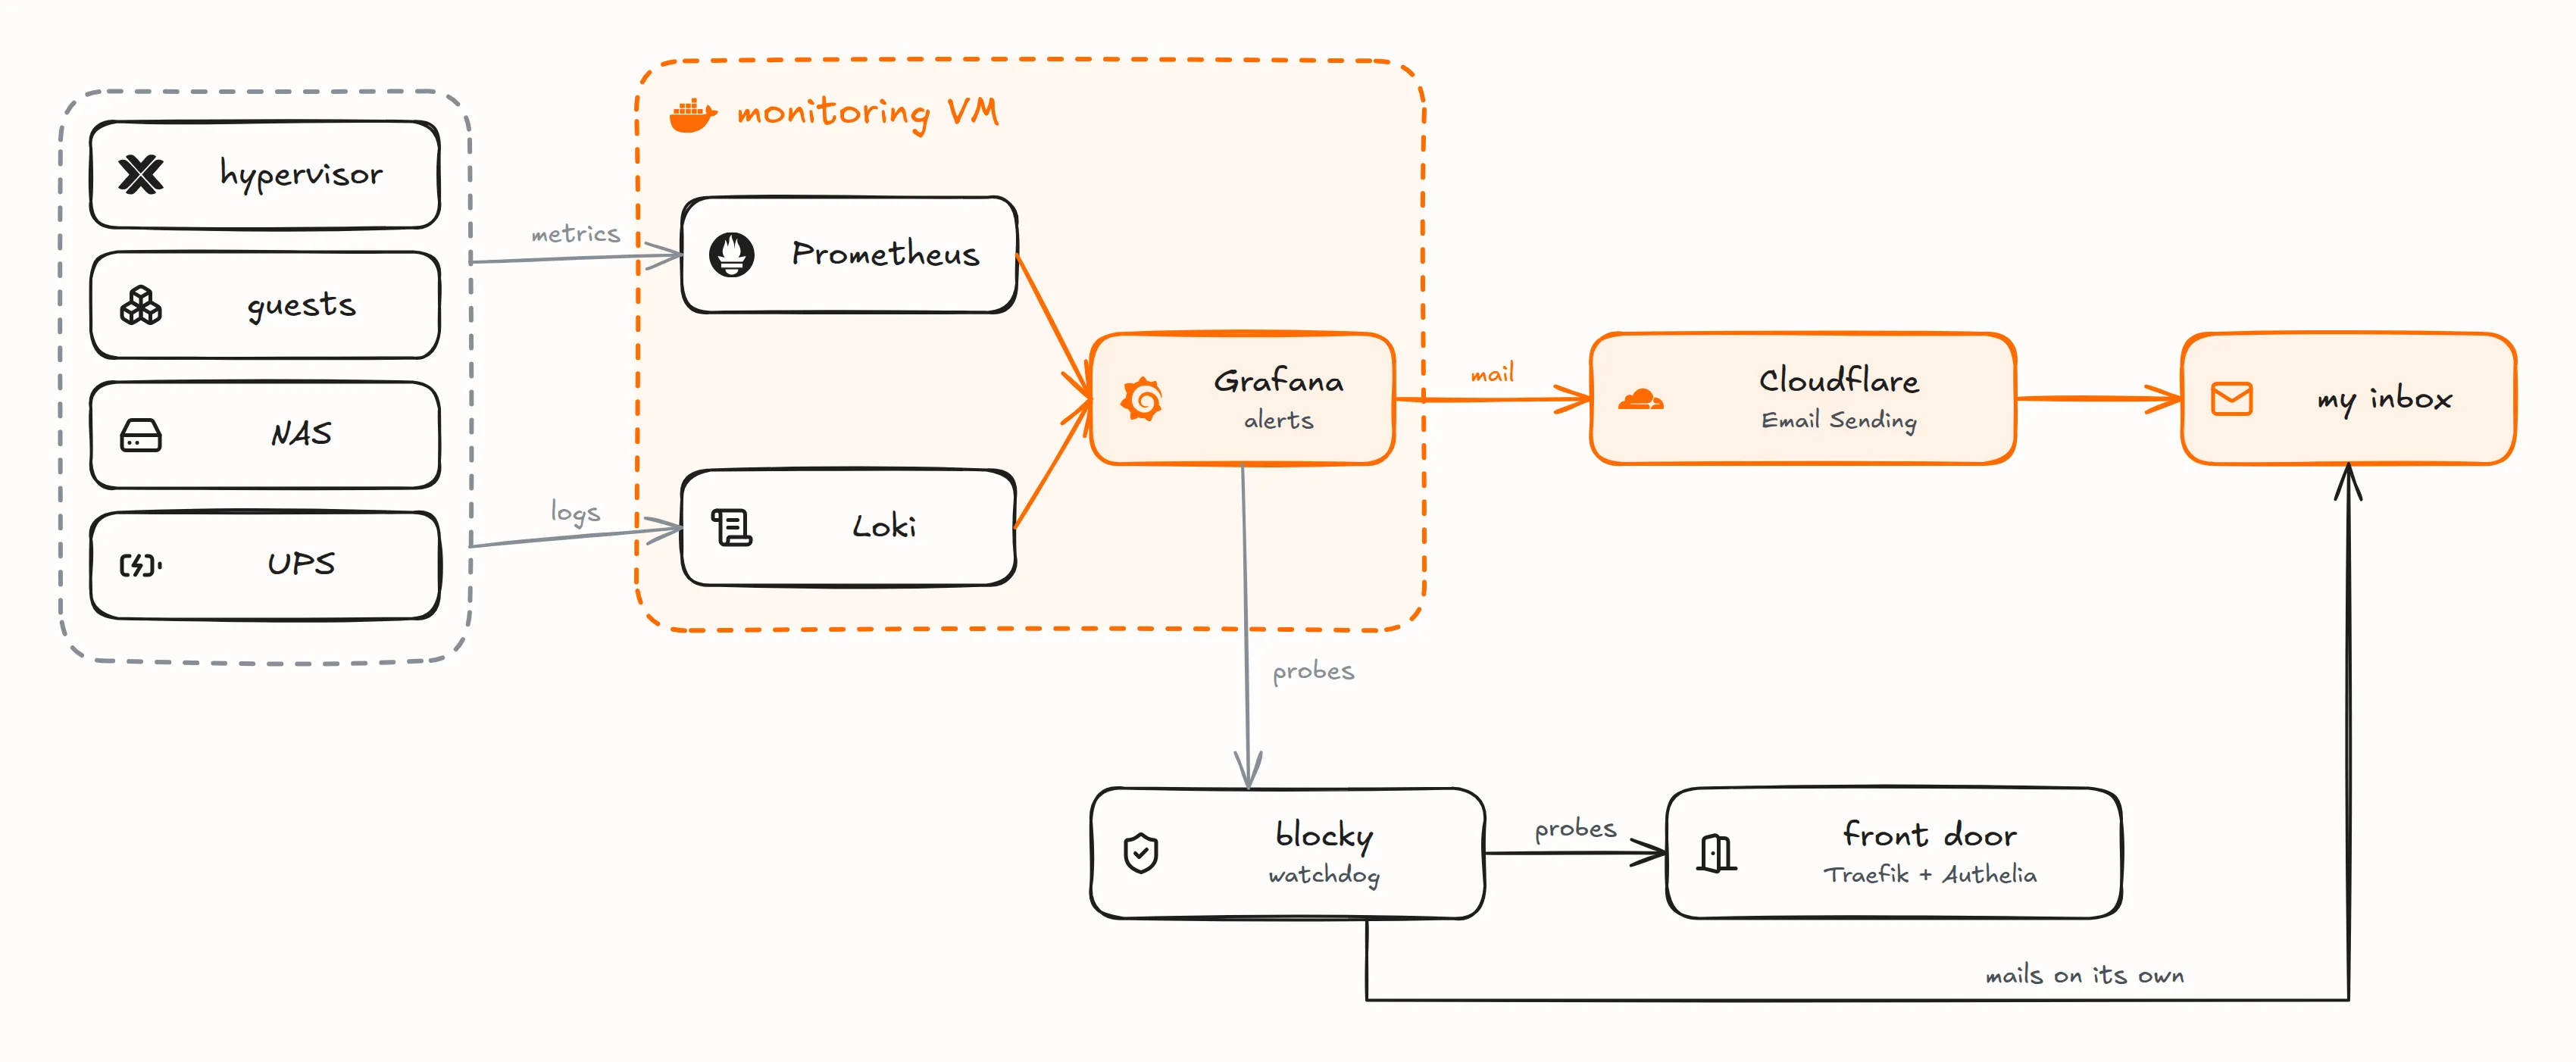
Alerts go out by email through Cloudflare’s Email Sending API, so their delivery doesn’t depend on the lab. When the front door fails, most of the lab goes with it, so it is also watched from outside the monitoring VM: a watchdog on the blocky guest probes Authelia through Traefik and mails me on its own after three failures, and Grafana in turn probes Blocky.

Over that week, the host’s CPU averaged about 5% and memory in use about 31 GiB of the 62 GiB Proxmox sees.
A tip if you run node-exporter in an LXC: it reports the host’s numbers as its own, because /proc is partly faked by lxcfs and /sys isn’t namespaced. Disable its host-reading collectors and let the hypervisor publish those metrics. A VM has its own kernel and keeps every collector.
What I accept
My target is to lose at most 24 hours of data, and to recover in hours from a software problem or in days from a hardware one. There is no uptime promise. So there is no RAID and no high availability, since that target calls for neither.
Having one box has its costs. If the hypervisor dies, the watchers die with it and nothing tells me. A file corrupted at the source is backed up, verified as intact and copied off-site like any other, since nothing checksums live data. And rebuilding from the off-site copy alone, on a new backup server, is written down step by step but has never been tried: attaching the bucket to a second server takes it over from the live one, so the test needs a copy of the bucket first.
The agents on those dev boxes also write the lab itself, in sessions I supervise, and I read each change before it lands. That is its own post.
Discussion on r/homelab.
Icons in the diagrams: Simple Icons (CC0) and Lucide (ISC).